A good old fashioned ringbuffer getting full and dropping messages problem. Brilliant. This is definitely what we want to happen in our production ITCH market data feed. You know, the delta stream where we broadcast every price change and trade to clients? The one where they expect low latency and to receive every event? Yep, definitely a problem.
How can a ring buffer get full?
Well, it means writes are occurring more frequently than reads – whatever is consuming messages is unable to keep pace with what is publishing them. The consumer will see delayed data during conditions like this – not what we want in an application intended to have low latency characteristics. One symptom of ringbuffer filling we often check is the maximum batch size of our consumer; we expect it to be spiky. That’s because it measures the largest amount of events available to process since the last time it checked. It’s a good metric to correlate with problems. (see James Byatt’s Monitoring Without Polling article for more information). Ultimately, bigger, more frequent spikes equates to bad. Let’s have a look at one of the stream’s maximum batch size…
So we definitely have a problem! We are running 14 of these delta streams concurrently, and all seem to have the same issue.
Slipped through the testing cracks
Why didn’t we catch this earlier?
We have a performance environment featuring this component – why don’t we see
this issue there? Well, when we look at the performance environment’s
metrics, it shows low latency and low batch size. We notice, however,
that the load configuration is set to have fewer delta streams, each
with fewer order books than the production configuration. Meaning that
there were fewer price changes coming. So each stream delivers an order
of magnitude less of messages. We changed the configuration to be like
production, and, hey presto, the metrics showed our familiar spiky batch
sizes.
 Problem reproduced (hurray).
A deeper look
Now that we have established a feedback loop for ourselves, we can start an
investigation. We now know the symptoms of the issue are relevant to the
amount of delta streams or the amount of price changes. Let’s
investigate by having a look at the ITCH gateway threading model.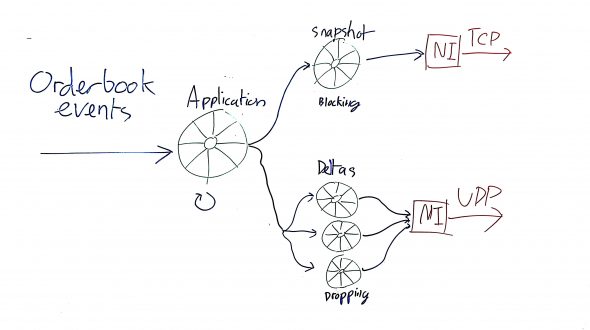 The ITCH gateway has two responsibilities: 1) Provide a delta update
of every order book event and broadcast it via UDP multicast; 2) Provide
a snapshot of the current order book. This is so clients can get a full
view of the order book and then apply the deltas to it. This request is
via TCP. When an event arrives into the application thread, this will
hand the event to the following threads: 1) The snapshot thread - this
will maintain a copy of the order book, and respond to snapshot
requests; 2) Each delta thread - if it cares about the event. It will
then marshal the event and send out the delta to the network interface
for some IO goodness.
It gets a bit weird
The ringbuffers that back the delta streams use a dropping overflow strategy; events will
be dropped by the writer when the buffer is full - this is the symptom
of our main problem. The alternative would be to block (to wait for a
free slot), but we want to avoid blocking the application thread;
particularly as the ITCH protocol itself allows downstream clients to
recover from this sort of drop. When we increase the amount of delta
streams we had in our performance environment, this happened to our
application ring buffer’s batch size max:
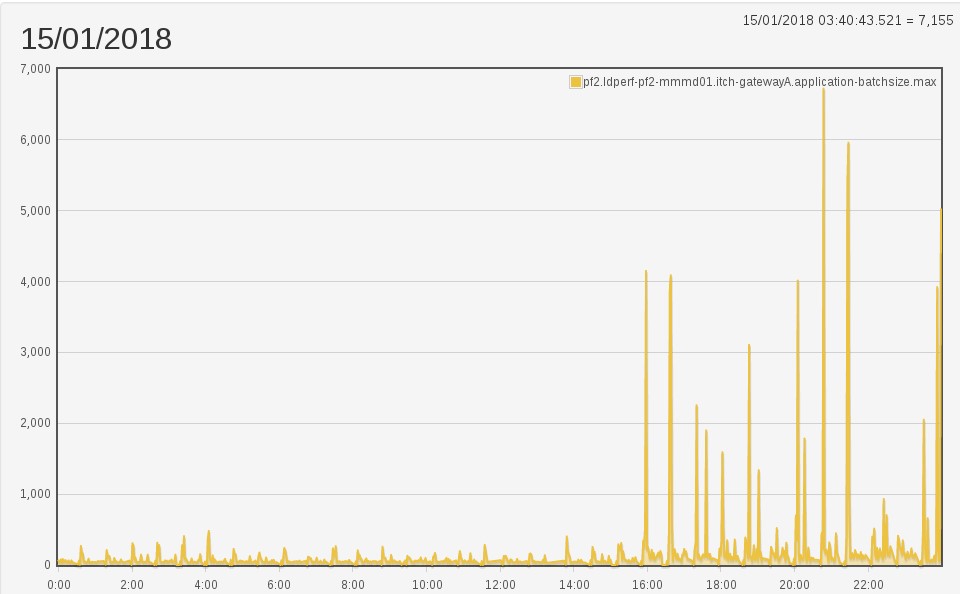 Considering what we know about the model, this is unexpected. The
application thread is only doing a bit more work now, which is to put
more messages in the delta ringbuffers. Underneath it is only assigning
something to an array, a very cheap operation. How could increasing the
amount of delta traffic have such a profound effect on the application
thread’s batch max? Well, the snapshot buffer thread uses a blocking
overflow strategy; it can’t afford to miss messages, because it has to
maintain a coherent picture of the orderbook. What does its batching
behaviour look like after our change?
 Different again! Now, that thread shouldn’t be doing any more work in
this configuration on the left or right side of the buffer. Yet it has
also regressed. The buffer size is 8192. Those spikes are filling the
ringbuffer, pushing back onto the application thread.
How has this happened?
We know that the snapshot and delta threads have no shared state in our application. We must therefore start to look outside our application for other things they might contend on. We need to look at what external resources the snapshot thread and the delta threads share.
- The snapshot and delta threads use different network interfaces.
- The snapshot and delta threads even use different network stacks:
- The snapshot thread runs on the standard Linux kernel stack.
- The delta threads all run on the Solarflare OpenOnload stack (but this does mean they all share the same stack).
- The CPU cores the threads run on.
Let’s look at the CPU affinity configuration.
Tons of threads
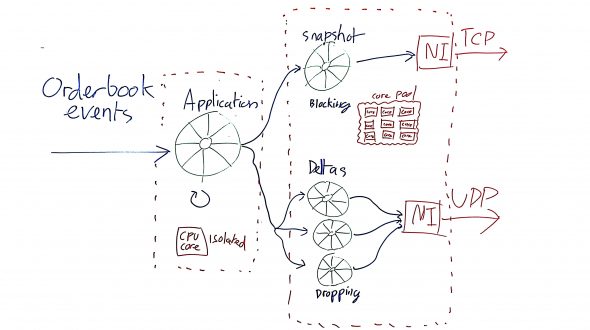 The application thread is bound to a single isolated core. This means
the core only has one job, which is to process the application thread
only. Not even the operating system can interrupt and give the core
tasks to do (isolcpus for the win). The snapshot and delta threads have
a pool of 18 non-isolated cores available to them. Meaning each thread
can hop between cores; they will be battling each other for some of that
sweet, sweet CPU attention. That overhead isn’t free. It would have to
reload its CPU cache every switch, rely on the OS scheduler to find an
available core and assign. All this can add up. These threads use
yielding strategies too, leading to expensive core usage even when no
data is being written to the buffers they read from.
Not tons of threads?
What if this is the problem? Is our shared pool for the delta
threads design harmful? Let’s run an experiment. We’ll do the work of
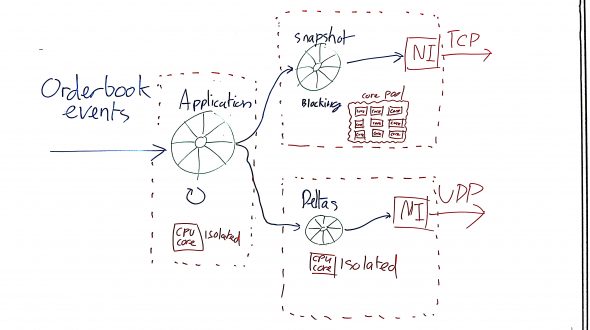
all the current delta threads onto a single thread. Our model now looks
like this:
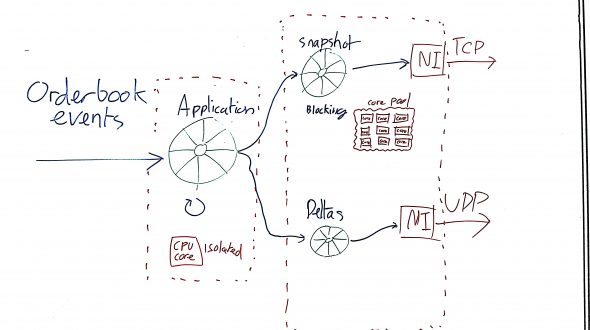 It’s still using the core pool, but we’re down to only two threads
having to wage war with many sibling threads for CPU attention. How do
our batch sizes look now?
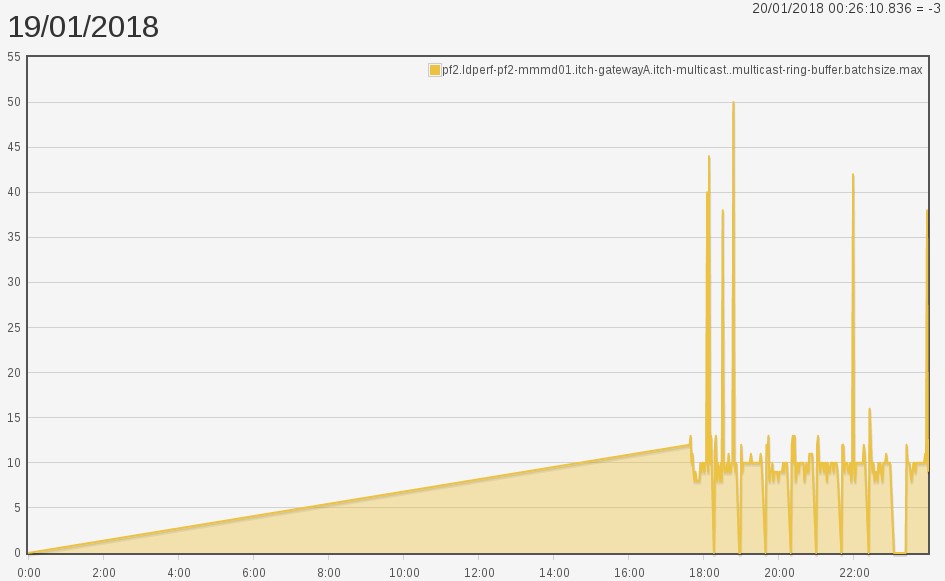 Completely different! Before we were seeing an individual delta spiking
into the thousands. In our new world, we have a single thread handling
all deltas teetering spikes at around 50. What does our snapshot and
application threads look like? Snapshot thread:
 Application thread:
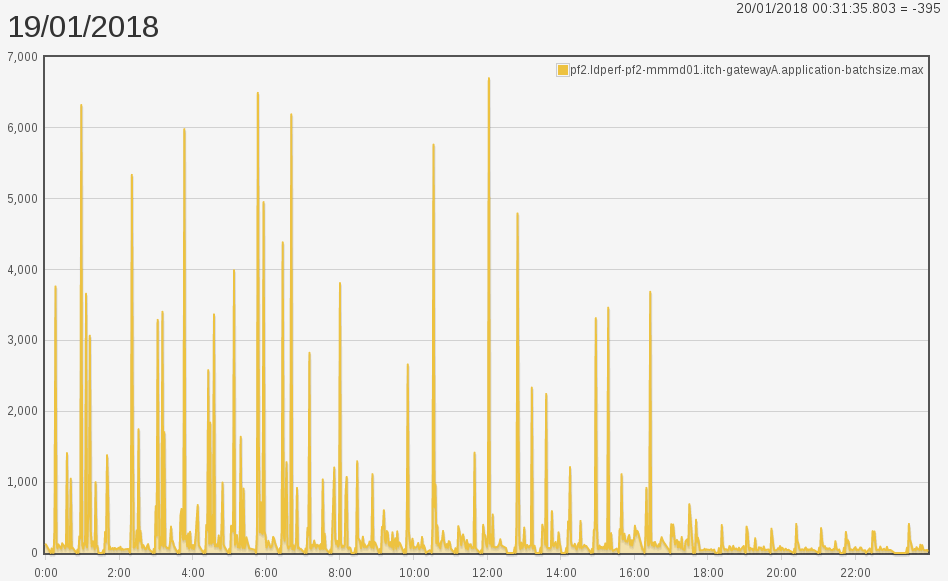 The snapshot spikes have gone from full capacity (8192) to around 600.
While mid run application spikes have vanished.
Isolation
This is a great improvement, but we can do more. What if we bind the delta
thread onto its own isolated core like we do for the application thread?
 Now what do our batch sizes look like?
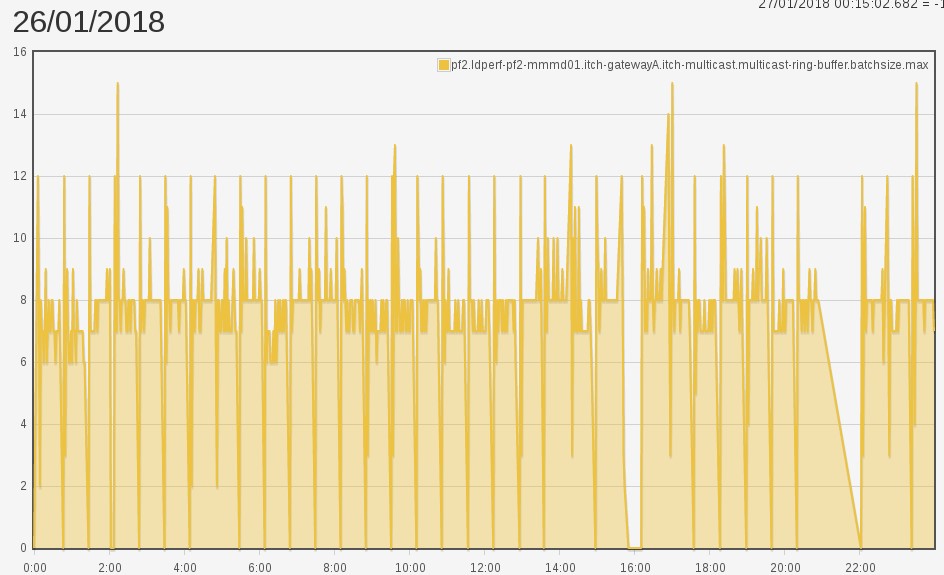 Fantastic! The spikes are no more. Problem resolved.
Things learned
Lesson 1
Get the performance environment exactly in line with production. If the state is not representative, performance regressions can sneak through the gaps.
Lesson 2
More threads != more power Obvious in hindsight. Even when there are more cores than threads, the more participants in the CPU race, the more tripping over will occur. It’s important to remember that half of the available CPUs are hyperthreads, too.
Lesson 3
It’s worth trying a simple solution first, even if you’re not sure it will be performant enough. Then listen to your performance measurements. Only if the feedback says it’s not good enough should you push for an improved solution; as part of this, you’ll have to decide what measurements are acceptable – something we hadn’t done at this application’s inception.

