In this series we are attempting to solve a clock synchronisation problem to a degree of accuracy in order to satisfy MiFID II regulations, and we’re trying to do it without spending a lot of money.
So far we have:
- Talked about the regulations and how we might solve this with Linux software
- Built a “PTP Bridge” with Puppet
- Started recording metrics with collectd and InfluxDB, and
- Finished recording metrics
- Drawn lots of graphs with Grafana and found contention on our firewall
- Tried a dedicated firewall for PTP
The start of 2016 opened up a few new avenues for this project. Both Solar Flare and the developer of PTPd showed an interest in what we were up to, and both suggested alternative designs to what we’ve tried so far. What I’ll look at first though is a purely switched design, ie: no Firewall. This is for two reasons; the PTP Bridge’s mean variance is 100ns from the Grand Master, if I can get the clients close to this, it’s a good achievement. Second, I’ve had to return the firewall I loaned from our Network Engineering team, and I’ve had to find myself two more clients for testing with (in other words I need to rebuild most of my test bed).
Multicast out multiple interfaces
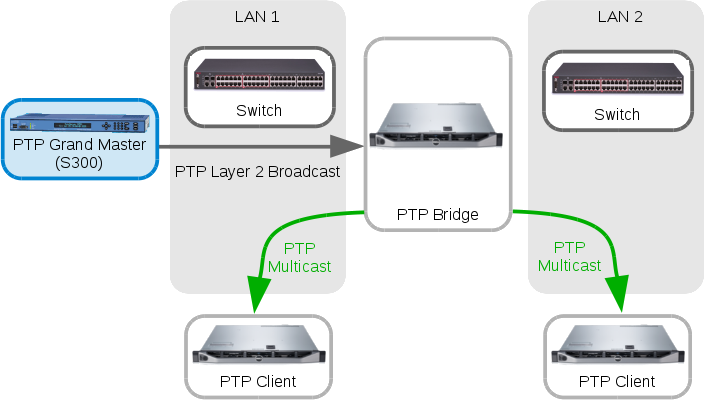
Here’s an adjusted design diagram of what we’re doing, emphasising that the bridge is now publishing individual streams of PTP onto more than one LAN:
With Puppet it’s pretty easy to turn one ptp4l instance and one supervisord program into two. In fact the amount of configuration needed has reduced quite a lot. We don’t have any multi-homed routing issues, so we don’t need any firewall marking for policy based routing on the PTP Bridge. A Puppet run and restart of supervisord now has the PTP Bridge multicasting out two separate interfaces.
My PTP clients are now receiving PTP multicast, but they are not getting any Delay Responses back:
2016-03-15 18:03:44.968187: warning: failed to receive DelayResp for
DelayReq sequence number 0
2016-03-15 18:03:45.280687: warning: failed to receive DelayResp for
DelayReq sequence number 1
2016-03-15 18:03:45.843188: warning: failed to receive DelayResp for
DelayReq sequence number 2
2016-03-15 18:03:45.843201: warning: failed to receive DelayResp 3 times
in hybrid mode. Reverting to multicast mode.
Another thing is a client on one network is getting the multicast from both interfaces, which should be impossible as there shouldn’t be any multicast routing or Rendezvous Point here, but our symptoms suggest there still is:
17:59:31.057579 IP 192.168.0.4.319 > 224.0.1.129.319: UDP, length 44
17:59:31.057626 IP 192.168.0.4.320 > 224.0.1.129.320: UDP, length 44
17:59:31.261173 IP 192.168.1.4.319 > 224.0.1.129.319: UDP, length 44
17:59:31.261227 IP 192.168.1.4.320 > 224.0.1.129.320: UDP, length 44
The double multicast feeds are messing with the client - it will only be able to Unicast back to one of them (the one on the local subnet) so the sfptpd daemon is rightly getting confused about who it’s master should be. The Best Master Clock algorithm won’t help in this circumstance as the clients are only able to communicate to one of the Masters by design, and the BMC algorithm is probably telling them to use the wrong one.
A quick look around our older software firewall that we used a few blog posts ago shows that we’ve still got RP config on there and the firewall is doing IGMP Querying on various subnets. Turning this off stops the second flow of multicast, but it also cuts off our local flow; the switch has stopped forwarding multicast to the clients. The switch also says it knows nothing about any PTP multicast group membership.
We always turn on IGMP Snooping here, so the switch maintains a list of ports to forward multicast to rather than broadcast out all multicast packets on the local subnet. The issue above arises because there’s no IGMP Querier on the subnet any more - it used to be the firewall but we’ve turned that off - so the switch doesn’t “know” where to send the multicast any more. We have an old home-grown fix for this, a little daemon written in C that we call ‘igmpqd’ that periodically broadcasts out IGMP Queries to force all the clients to reply. If we configure and start igmpqd on the PTP Bridge, very soon we have our switch aware of multicast group membership and PTP is flowing again.
The graphs below show a few minutes of offset tolerance from both clients. The top set is PTP through the ASIC firewall from my last post, the bottom set is the switch-only design:
The results look good, ±2μs is the best I’ve seen so far. The results look even better if you take a look over several hours:
Once again the top graph through the ASIC firewall, and the bottom is our most recent results through just a switch. What’s immediately apparent is the large reduction in spikes when we’re not running through the firewall.
Before we jump to any conclusions (or go running to the Networking team with a big “I told you so” grin on our faces), lets remind ourselves that we’ve had to use two different clients than what we had before. While the clients themselves are the same hardware as each other at this moment, they are different to the previous pair of clients. They are in the same rack though, so they are not physically further away than the previous clients (think switch hops).
The last big thing that could be different is the way the clients were configured - without having the old clients in front of me now it’s impossible to tell whether they were actually busy running something that was interfering with our results, rather than idle. Looking at the new results I now have a sneaking suspicion that my previous clients were in fact running some part of our production workload. The down side of doing this work on the cheap without a dedicated test bed is you risk running into these repeatability problems…
Anyway, we have some evidence (whether it is as credible as it looks or not) to support the theory that the switch only design is “better”. but why are we not a lot closer to the 100ns accuracy that the PTP Bridge is reporting it’s getting from the Grand Master Clock?
Running with Wrong Assumptions
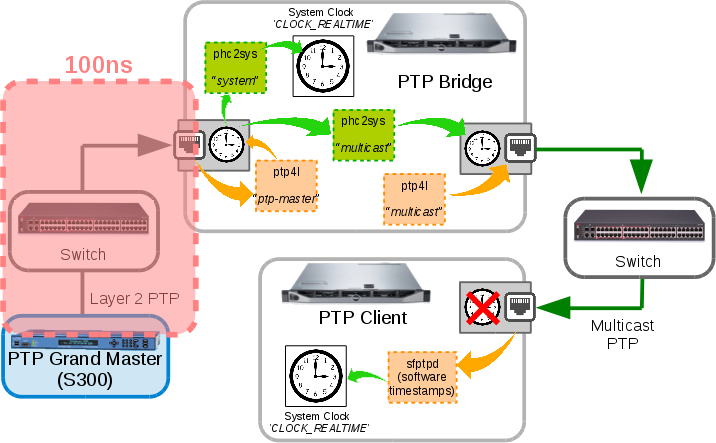
Last post I said “The PTP Bridge generally keeps a baseline of 100ns accuracy” and I then went running with the assumption that we should be able to achieve a similar accuracy on the clients. Turns out this idea was flawed. The 100ns as a value is correct, but this is a measurement based on the hardware timestamp of the ingress of the PTP packets from the GM. To then go and assume that it would take another 100ns to get to a PTP Client ignores quite a lot of the other moving parts. I’ve extended a diagram I made previously that showed how each of the PTP Bridge components interact to show exactly what is and what is not in that 100ns from GM to Bridge:
As you can see the 100ns in ingress is only a small part of the system. This does not account for the time spent synchronising the ingress PTP Hardware Clock time to other interface PHCs, and it’s during these times that we can be hit by scheduling delays or other interruptions. The phc2sys program outputs statistics for this though, so let’s look.
Here’s a sample of the output from one of the “multicast” phc2sys processes, which is reading from the PHC that is receiving PTP from the grand master and writing to the PHC that is sending multicast to the client:
phc2sys[11830930.330]: phc offset -11 s2 freq +34431 delay
4959
phc2sys[11830931.330]: phc offset 1 s2 freq +34439 delay
5327
phc2sys[11830932.331]: phc offset -27 s2 freq +34412 delay
5711
phc2sys[11830933.331]: phc offset 1 s2 freq +34431 delay
5599
phc2sys[11830934.331]: phc offset 21 s2 freq +34452 delay
4895
phc2sys[11830935.331]: phc offset -120 s2 freq +34317 delay
5695
Over time it’s consistently around ±100ns for every phc2sys process running. Our experience with performance tuning our Java applications makes me distrust these numbers at first, they sound too small to be true. Looking at the phc2sys man page and code, the program takes a -N option which controls how many times it reads the master clock, and then chooses the values that were read the fastest, thus trying it’s best to reduce any scheduling or bus delays. So perhaps the numbers are more accurate than I originally thought, but I lack an independent reference time source in the PTP Bridge to verify them.
Hardware Timestamping on a Client
I’ve wanted to try hardware timestamps on a client for a while now. It might also bring the design closer to sub microsecond accuracy. There is a development branch of PTPd that supports the Linux PHC API on bonded interfaces, so we’re going to give it a go. Building it into an RPM is pretty easy, there’s an rpmbuild wrapper script provided. If you are going to try it out I would suggest you add –enable-runtime-debug to the ./configure lines in the RPM Spec file, this allows you to set to various levels of debug logging in the configuration file.
To get this done very quickly I haven’t done any Puppet work for PTPd, it’s all configured by hand (gasp!). I will do it later when I try PTPd as the replacement software on the PTP Bridge. Turning off sfptpd and turning on ptpd is simple - just need to set which interface, the mode, and turn on stats logging, the rest of the defaults in /etc/ptpd.conf are fine:
ptpengine:interface=bond1
ptpengine:ip_mode=hybrid
global:statistics_file=/var/log/ptpd.stats
With the daemon running it is consuming multicast PTP from the PTP Bridge. There is a statistics file that reports the most recent metrics in a nice to read format, however at the moment I prefer to plot every data point, so will be looking at the statistics log, which is in CSV format:
2016-04-01 15:38:44.759881, slv, 001b21fffe6fa06c(unknown)/1, 0.000000000, 0.000012141, 0.000000000, 0.000024282, 550.827026367, S, 05623, 0.000000000, 0, 0.000000000, 0 0.000024282, 0.000000000
Parsing this file should be easy, it is comma separated and there’s even a tail_csv plugin for collectd. Unfortunately tail_csv got added in collectd-5.3, and I’ve got the old CentOS 6 collectd-4.1. After finding a 5.5 RPM for CentOS 6 I wasn’t able to get the tail_csv plugin working (Segfault) so gave up after a short amount of time.
I’ve been following the Influx Data projects, so wanted to see if Telegraf, their metrics collector, could do what I want. Unfortunately they also don’t have a “tail” like plugin (there is a feature request), only an Exec plugin, so wouldn’t quite work for what I wanted to do. So back to collectd’s normal tail plugin. Writing and debugging non-Perl regular expressions for collectd turned out to be like pulling teeth - I seemed to be making what should be a simple problem unnecessarily difficult.
I have a stream of CSV lines that I want to extract certain fields from and then shoot them off to Influx; why I didn’t think of Tail + Awk before I’ll never know. I already have an Exec job in collectd that prints out the NTP offset every second, I can use the same approach to tail the PTPd stats log, send it to Awk for easy field splitting and then output the keys in collectd format that will get sent to Influx. Here’s the Awk script:
It uses my custom Collectd types, and converts from PTPd’s unit of seconds into nanoseconds. This is purely a cosmetic thing - Grafana is good at upscaling metrics (if you have 1000ms it will say 1s) but bad at downscaling (0.00000012s is hard to read).
There’s a small side affect with using Collectd’s Exec plugin, it wakes up every second, which end up sending multiple data points per second all at the same time, rather than an even spacing of 4 Sync messages per second. This is not a huge problem because a lot of the Grafana graphs will do an implicit Mean() over a given time period, and my Tolerance graphs use Min() and Max() functions. If we ever look at the raw data though it would look rather strange. I keep saying I will move away from Collectd, but the streaming-style Exec plugin is a just too easy to use at the moment.
Delay Messages, and PTP on cheap NICs
There’s a problem indicated in the PTPd stats line above - the fourth column, One Way Delay, and the sixth column, Slave to Master, are always zero. Slave to Master communication is the Delay Request / Response messages, so there’s something wrong with the Slave sending Unicast back to the Master (Unicast because we are in hybrid mode). This mode works with sfptpd on this machine, so architecturally there is no problem (no routing issues, etc). If we tcpdump we can see the Delay Request leave the Slave and we get a Delay Response from the Master, so there’s no networking problem.
If we turn on runtime debugging (hence the –enable-runtime-debug RPM build option above), we see that PTPd is attempting to handle a Delay Response message, but it doesn’t think it’s waiting for a response so drops it:
2016-04-05 15:23:16.947792 ptpd[101366].bond242 (debug1) (slv) ==> Handle DelayResp (9)
2016-04-05 15:23:16.947797 ptpd[101366].bond242 (debug3) (slv) Timer DELAY_RECEIPT start requested at 20. 0 sec interval
2016-04-05 15:23:16.947804 ptpd[101366].bond242 (debug2) (slv) timerStart: Set timer DELAY_RECEIPT to 20.000000
2016-04-05 15:23:16.947811 ptpd[101366].bond242 (debug1) (slv) Ignored DelayResp sequence 9 - wasn’t waiting for one
This appears to be a software issue, so I got in touch with Wojciech Owczarek, the developer of PTPd. The first diagnosis is that PTPd had an issue reading the packet transmission timestamp of the Delay Request message, and thus was not expecting a Delay Response. This is almost always caused by PTPd being unable to read the TX hardware timestamp from the NIC, which is almost always caused by the NIC not providing a hardware timestamp for the Unicast Delay Request packet. This is strange, as “ethtool -T” says this Intel i350 GbE Controller supports hardware timestamps…
High grade network cards designed for packet capture workloads (like Solar Flare 7322s) have full hardware timestamping support, as in they will provide a NIC generated timestamp for every packet. This obviously requires a bit more silicon than normal and drivers to support the extra timestamp data as well as packet data, and so these high end cards are expensive. Many other server grade NICs support hardware timestamps, but for PTP packets only, and the cards themselves enforce this.
Exactly what a certain model of card does can be difficult to determine
- the Intel Data Sheets are a largely beyond my ability to interpret. There is a good white paper that talks about the hardware timestamping capabilities of some Intel NICs in a sensible way (Section 6). One of the methods the cheaper NICs do to enforce hardware timestamps only on PTP packets is to use a hardware packet filter on certain MAC addresses. Since the Multicast address for PTP is a standard address, a NIC can filter on this and provide hardware timestamps just for PTP into a single register, and the driver can just read from that single register to get the packet timestamp. Since PTP is generally no more than a couple messages a second one register is enough. My guess is it’s a great deal cheaper for NIC manufacturers to add a single register for PTP support, rather than implementing a high grade “timestamp every packet” solution.
Wojciech’s diagnosis was that this was what was happening here - the Intel I350 was not providing a hardware timestamp for the Unicast PTP Delay Response message because the packet didn’t match the hardware filter. His suggestion was to change from hybrid mode back to multicast mode. This took all of seven seconds and after a restart we now have stats about the Slave To Master offset and PTPd appears to be operating normally.
Interference
PTPd gives you a little bit more information that sfptpd. It will report the Master to Slave offset and the Slave to Master offset, which are the two offsets used to calculate One Way Delay (which is reported by sfptpd as Path Delay). While the values of these two metrics are largely useless when looked at individually, compared together and over a period of time can indicate a problem with PTP. After collecting metrics for a few minutes, an interesting pattern started to emerge regarding the Slave to Master offset.
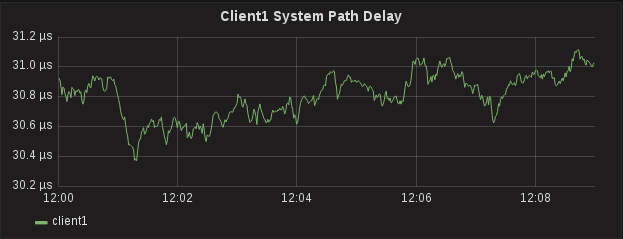
The first graph below is the Path Delay for Client1 (which is still running sfptpd for comparison) is consistently around 31μs ±1μs, which is the number it has been at for months, nothing surprising there:
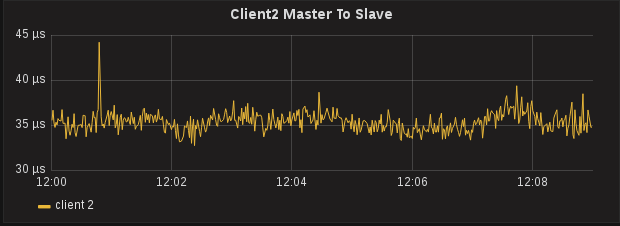
The Master to Slave offset of Client2, now running PTPd, is pretty stable at 35μs. Note that the actual value compared to Client1 here is not important, this value is greatly dependent on network architecture, and it could be that Client2 is taking a few more switch port hops than Client1, depending on which interface is the active member of the bond:
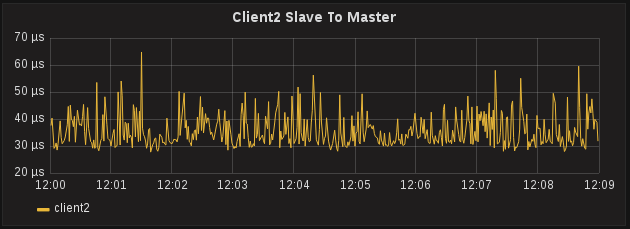
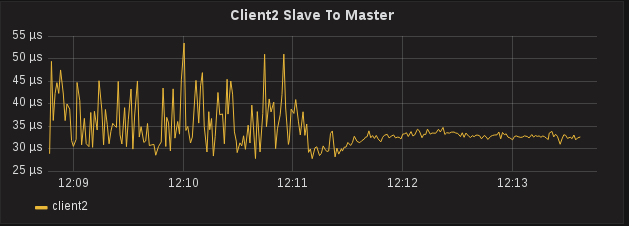
The one that looks strange is Client2 Slave to Master offset. This should be roughly the same as Master to Slave, it’s the same path across the switches, but here we see 30μs with spikes up to 50μs:
The Slave to Master offset looks strange, and because these intermediate offsets are part of what PTPd uses to calculate adjustments, our accuracy is slightly affected:
Client1 is ±2μs while Client2 is ±4μs - how is sfptpd with software timestamps performing better than PTPd with hardware timestamps?
The hint is in the variance in the Slave to Master offset. The graph shows us we’re getting upwards of 20μs variance in either the egress/TX time from the Slave or the ingress/RX time on the Master, which are the two timestamps that would affect Slave to Master offset. Client1 does not appear to be affected, so probably not the RX time on the master but something to do with Client2.
With the server now suspect it was pretty fast to find what the problem was. Somewhere during the development of the extra monitoring and trying out new versions I’d gotten Collectd into a Segfault-restart loop (it was crashing and respawning over and over). My NTP offset sanity check script is a Collectd Exec plugin that “always runs”, and it looks like every time Collectd crashed and restarted it spawned a new NTP monitoring script. I had 140 instances of a script running doing 140 NTP queries every second to an NTP server. This is the cause of the interference. You can probably guess at what time I killed the runaway scripts:
Client2 has now stabilised, but the accuracy is still no where near what I was expecting. In fact, it’s almost on par with Client1 in almost every metric taken. Why are software timestamps equal to hardware timestamps?
Hardware Timestamps on a Client, Actually
Something was not right. When Wojciech first told me about the 2.3.3-hwtest branch of PTPd he also gave me a sample configuration file with a number of additional filtering options. I’d been using the defaults, which, aside from the extra filtering, were missing one very important option:
ptpengine:hardware_timestamping=y
I think you can guess what that does. Configuration problem fixed, PTPd is now using the Linux PHC API:
2016-04-07 11:26:05.863773 ptpd[58310].bond242 (info) (init) bond242 is a bonded interface, current active slave: em2
2016-04-07 11:26:05.863787 ptpd[58310].bond242 (info) (init) Underlying physical device: em2
2016-04-07 11:26:05.866849 ptpd[58310].bond242 (info) (init) Hardware timestamping successfully enabled on em2
2016-04-07 11:26:05.867864 ptpd[58310].bond242 (info) (init) clock.linuxphc: Linux PHC clock driver em2 starting
2016-04-07 11:26:05.867888 ptpd[58310].bond242 (info) (init) clock.linuxphc: Successfully started Linux PHC clock driver em2 (/dev/ptp1) clock ID ffffff8b
2016-04-07 11:26:05.867895 ptpd[58310].bond242 (notice) (init) clock: Clock em2 changed state from INIT to FREERUN
2016-04-07 11:26:05.868921 ptpd[58310].bond242 (info) (init) clock.linuxphc: Linux PHC clock driver em1 starting
2016-04-07 11:26:05.868942 ptpd[58310].bond242 (info) (init) clock.linuxphc: Successfully started Linux PHC clock driver em1 (/dev/ptp0) clock ID ffffff83
2016-04-07 11:26:05.868955 ptpd[58310].bond242 (notice) (init) clock: Clock em1 changed state from INIT to FREERUN
After running for a few minutes we’re now looking a lot better. Our offset tolerance is ±200ns, the best we’ve seen so far:
If we look over a longer period of time PTPd with hardware timestamps is generally a lot more stable both from the hardware timestamps and the better outlier filtering it does:
Another interesting change in metrics is the Slave to Master and Master to Slave offsets, we’ve dropped from 30μs to 21.6μs:
By moving the point in where we timestamp from being in software to being ingress into the NIC, we’ve taken off 10μs of latency. From here you can observe that the time it takes to go from the NIC, through the kernel and into software is 10μs, which is comparable to the performance gain we see when using kernel bypass stacks like Solar Flare Onload. Not very relevant for clock sync, but it’s nice to have independent numbers line up.
This raises a question though: if hardware timestamping was not enabled when we had the problem with PTPd ignoring Delay Response messages, then why was PTPd failing to read the transmit timestamp of the Unicast message? It would mean it was failing to read the software timestamp of a Unicast packet. One for the ptpd project GitHub issues, once this branch of code is merged. It does mean though that we can try Hybrid mode again… Yes, it works, so Unicast TX timestamps do work on the Intel i350 in this server and we’re back to using a slightly less network intensive mode of PTP.
Terminology and Language
The MiFID II regulations have forced the Finance sector into areas where they may not have usually cared about before, so there are people, like myself, jumping into the unknown territory of clock synchronisation. One of the problems whenever you get started in new territory is finding what already exists. It is important to remember that other industries have solved these sorts of clock sync problems before, so there’s a lot of learning that’s already been done and standards that exist, and if we’re not careful we’ll end up reinventing the wheel and coming up with a whole new set of language for the same thing.
One example is what I’ve been graphing as Offset Tolerance, which is the minimum and maximum offset over a set time period that shows the “how bad” the offset was for a given range of time. Turns out there is a well defined term for this called Maximum Time Interval Error (MTIE) that was standardised by the International Telecommunications Union over a decade ago.
Guilty. I’ll be renaming that, and will endeavour to use similar terms as our Telecom colleagues.
What’s Next?
I’m pretty happy with these results. ±200ns is the best we’ve seen, and it seems very stable, I think for our use case we don’t need to try go any lower at the moment. We’ve got a proof of concept design, although now I’d really like to go back and try the ASIC firewall again, as I suspect my previous results were tainted by system load. Most importantly we’ve got a PTP client that supports bonded interfaces and hardware timestamps on the model of NIC controller we have in some of our servers here.
There’s a few things I think need to be tackled first before we starting looking at a roll out:
- PTPd to sync Solar Flare cards - we want to make sure we can receive accurate PTP over a cheap NIC and sync the clocks of expensive Solar Flare capture cards in the same server.
- Failure monitoring and recovery - we’ve seen PTPd work well, what if it fails? It’s infeasible to constantly watch hundreds of graphs - how do we alarm about it? Can we recover nicely or automatically? Can we somehow revert to NTP if we’re in trouble?
- PTP Bridge Resiliency - the PTP Bridge currently uses a mix of linuxptp software (ptp4l and phc2sys), can we use PTPd to replace this and get a little resiliency from bonded interfaces? What if the Bridge dies?
Failure monitoring is probably the most important here before we can look at any sort of internal roll out. The PTP Bridge is missing some Puppet work though, so perhaps next will be a Puppet module for PTPd.
